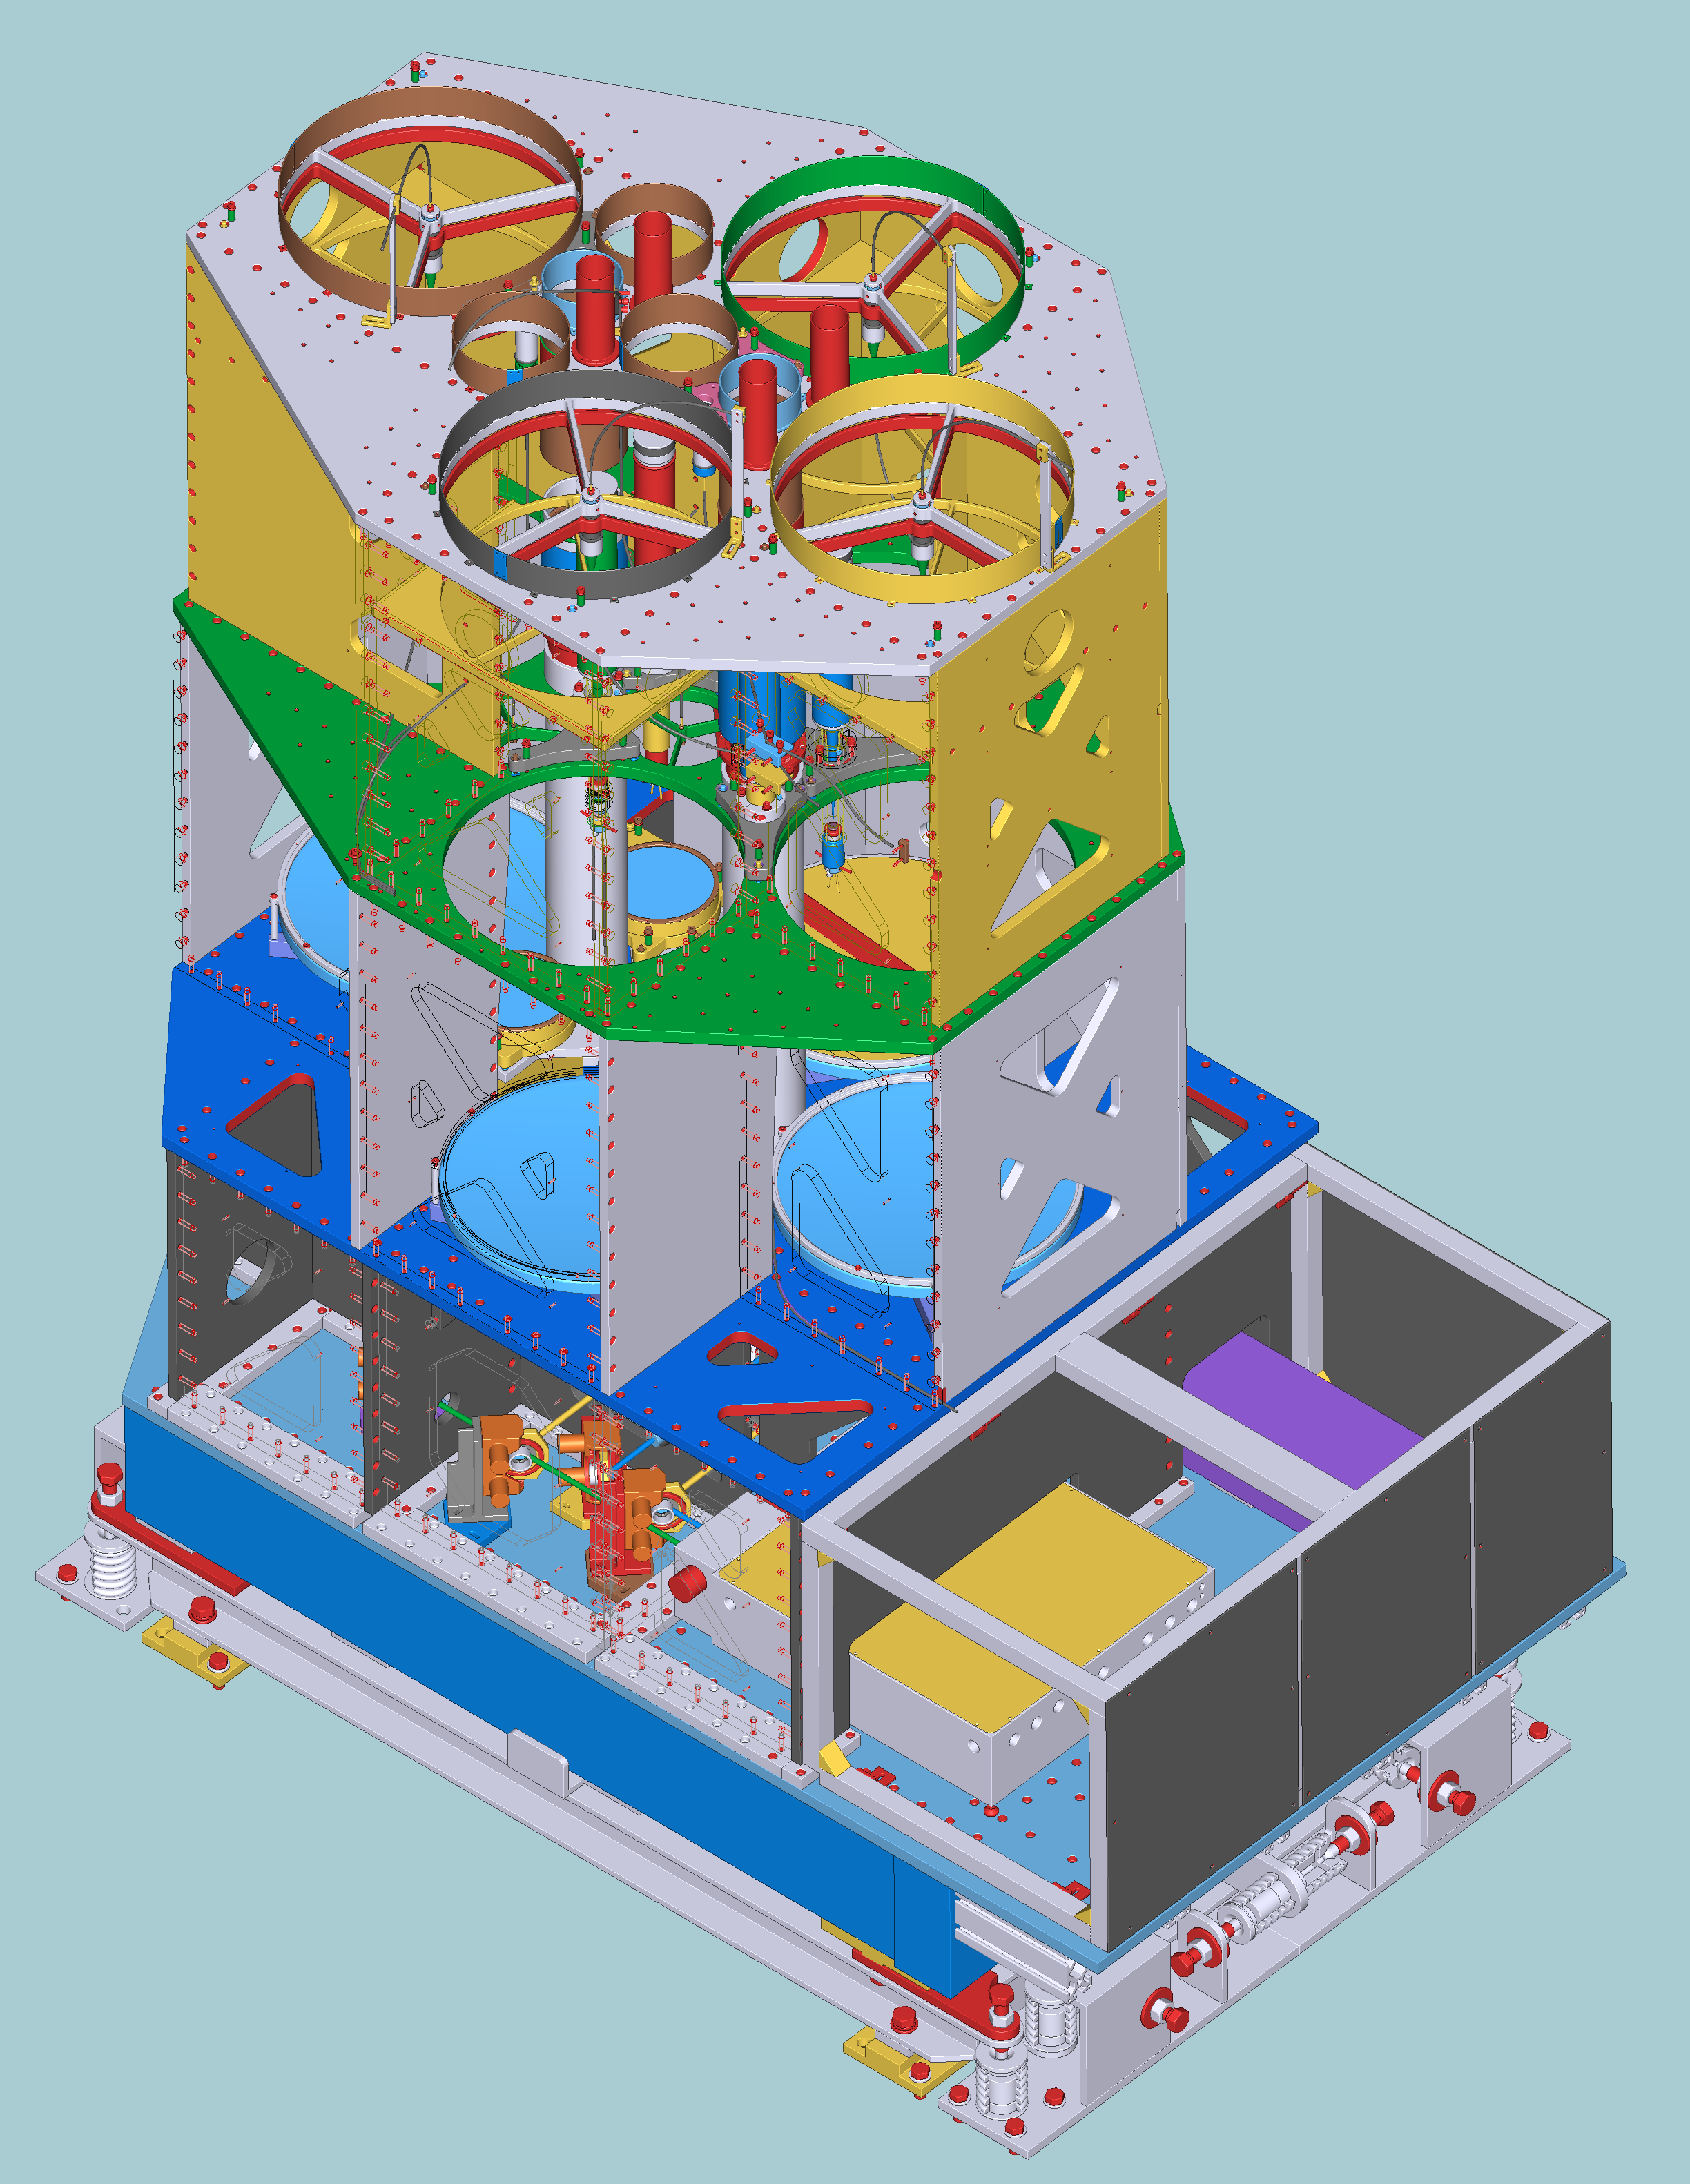
CORAL lidar
High power lidar component of CORAL system (Cloud Observation with Radar And Lidar) has been designed for high resolution vertical profiling of water vapor mixing ratio (being the major interest for us), air temperature and also clouds and aerosol properties. The scientific task put on target for the instrument is to provide observational data to investigate fast processes driving cloud formation and to reveal the interaction of moisture field, air temperature, aerosols and cloud droplets in tropics. CORAL lidar has been put in operation at BCO in May 2019.
Technical characteristics
| Pulse repetition rate | 100 Hz | ||
|---|---|---|---|
| Laser pulse energy | @ 355 nm | @ 532 nm | @ 1064 nm |
| 350 mJ | 150 mJ | 150 mJ | |
| Laser beam diameter | 80 mm | ||
| Laser beam divergence | 70 µrad | ||
| Operating range | @ 355 nm | @ 532 nm | @ 1064 nm |
| 0 - 29 km | 0 - 29 km | 0 - 15 km | |
| Receiving telescopes, elastic returns stimulated with 1064nm | |||
| telescope ID | Focal length | Diameter | Field-of-view |
| “Far-range” | 1200 mm | 400 mm | 330 µrad |
| “Near-range” | 450 mm | 150 mm | 670 µrad |
| “Close-range” | 100 mm | 22 mm | 2000 µrad |
| “Depolarization” | 500 mm | 50 mm | 500 µrad |
| Receiving telescopes, elastic and pure rotational Raman returns stimulated with 532nm | |||
| telescope ID | Focal length | Diameter | Field-of-view |
| “Far-range” | 1200 mm | 400 mm | 250 µrad |
| “Near-range” | 450 mm | 150 mm | 450 µrad |
| “Close-range” | 100 mm | 22 mm | 2000 µrad |
| “Depolarization” | 500 mm | 50 mm | 500 µrad |
| Receiving telescopes, elastic and pure rotational Raman returns stimulated with 355nm | |||
| telescope ID | Focal length | Diameter | Field-of-view |
| “Far-range, narrow FOV” | 1200 mm | 400 mm | 250 µrad |
| “Far-range, wide FOV” | 1200 mm | 400 mm | 330 µrad |
| “Near-range” | 450 mm | 150 mm | 450 µrad |
| “Close-range” | 100 mm | 22 mm | 2000 µrad |
| “Depolarization” | 500 mm | 50 mm | 500 µrad |
| Receiving telescopes, vibrational Raman returns stimulated with 355nm | |||
| telescope ID | Focal length | Diameter | Field-of-view |
| “Far-range, narrow FOV” | 1200 mm | 400 mm | 250 µrad |
| “Far-range, wide FOV” | 460 µrad | ||
| “Near-range” | |||
| “Close-range” | |||
| “groundClose-range” | |||
Parameters measured
| Product | Wavelength of emission stimulating lidar return |
|---|---|
| Attenuated backscatter | 1064, 532, 355 nm |
| Particle backscatter | 532, 355 nm |
| Particle extinction | 532, 355 nm |
| Volume linear depolarization ratio | 1064, 532, 355 nm 1) |
| Particle linear depolarization ratio | 532, 355 nm 1) |
| Cloud mask | 532, 355 nm |
| Water vapor mixing ratio | 355 nm |
| Air temperature | 355 nm |
| Relative humidity | 355 nm |
1) depolarization measurements will be activated when achieving sufficient depolarization purity of stimulating laser emission
DATA ACCESS
Data recommended for scientific use is the calibrated quicklook dataset stored under:
/opt/pool/OBS/ACPC/RamanLidar-CORAL/3_QuickLook/nc/
There are two set of data produced with different height coverage and resolution, designated as “lowResolution” and “highResolution” data. Timeseries with relatively low resolution covering altitudes up to 29 km with 24 hours time span and dedicated primarily for general overview on the data quality could be found with template link of:
/opt/pool/OBS/ACPC/RamanLidar-CORAL/3_QuickLook/nc/lowResolution/qlYYMM/coral_YYMMDD_0002_0000_[b|t].nc
High resolution data structured in hourly files represent measurements for lower 3 km altitude. This data could be found under:
/opt/pool/OBS/ACPC/RamanLidar-CORAL/3_QuickLook/nc/highResolution/qlYYMM/qlYYMMDD/coral_hr_YYMMDD_hhmm_hhmm_[b|t].nc
Both low and high resolution data have the same filename template with YYMMDD being the timestamp for the year 20YY month MM and day DD. Placeholder “hhmm_hhmm” in filename specifies the processing period given as the ending hour “hh” and minute “mm” of measurement for the first and last vertical data slice included in the file. For instance, for low resolution data with “two-minute-long” slices the first slice ends at 00:02:00 UTC of the day while the last slice ends at 00:00:00 UTC of the next day, therefore the processing period covering 24 hours is given as “0002_0000”. For high resolution hourly files with “four-second-long” slices the period coded, for example, as “0300_0400” would correspond to the first and last slice ending time of 03:00:04 and 04:00:00 respectively.
Letters “b” and “t” alternatively placed as the last symbol in filename template used to code the file content. Timeseries of particle backscatter coefficient, cloud mask, water vapor mixing ratio and depolarization ratio (presently not calibrated) are stored in “b”-files. Air temperature, water vapor mixing ratio (calculated with resolution taken for temperature profiles) and relative humidity put in “t”-files.
Data availability and data quality could be assessed with quicklooks plot either online under
http://bcoweb.mpimet.mpg.de/quicklooks/lidarql/RamanLidar-CORAL/
or accessing directly the data server:
/opt/pool/OBS/ACPC/RamanLidar-CORAL/3_QuickLook/pdf/lowResolution/co20YY/coYYMM/coral_YYMMDD_0002_0000.pdf
/opt/pool/OBS/ACPC/RamanLidar-CORAL/3_QuickLook/pdf/highResolution/co20YY/coYYMM/coYYMMDD/coral_hr_YYMMDD_hhmm_hhmm.pdf
Another tool allowing deeper look into CORAL lidar data with most easy touch is additionally developed. This is what we call click-quick-looks, which is a set of standalone interactive html plots allowing with a single mouse click to relate two lidar products by direct comparing height and time series. The interactive concept is natural and easy to understand, simply clicking in bitmap presenting one or another lidar product we get the cross sections to compare. An example of the html quick-click-look file could be tested under:
Since July 4, 2019 the click-quick-look plots are produced with automated data processing scripts for high-resolution CORAL lidar data on hourly base.
In the latest version of code the click-quick-look plots visualize a larger number of lidar products for comparison. More interaction is added to time- and height-series plots. It is, for instance, showing or hiding profiles by mouse clicking on items in the plot legend. Optional extra smoothing with individual control for each profile is also implemented to extend the flexibility of data analysis. Cross-hair moving mode could be selected there among three regimes, either along time or height axis or in both directions. So-called hover hint feature is activated to improve the readouts of values plotted. And some more features… This extended version is still under testing phase but few first plots are already made available. Please try html files stored under:
Input data for extended version of click-quick-look html-plots are available with the same link.
Visualization code of click-quick-look plots is written with Bokeh library (https://bokeh.pydata.org/en/latest/) that solved and took away all typical plotting-related concerns allowing to focus just on the concept of data comparison. Here we would like to express a special thanks to:
Bokeh Development Team (2019). Bokeh: Python library for interactive visualization URL https://bokeh.org