CORAL Ka-Band Cloud Radar
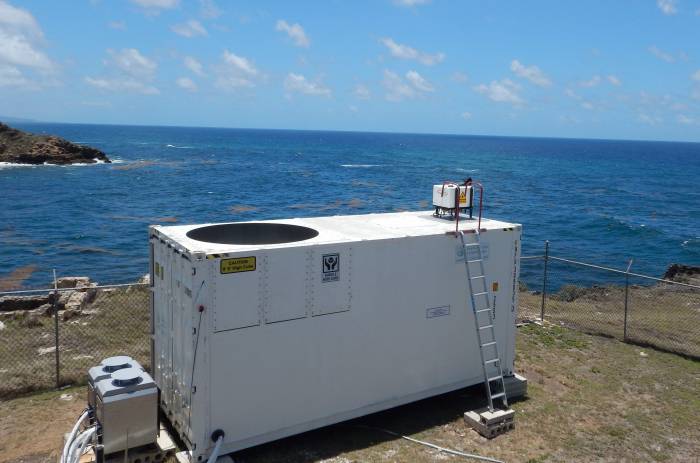
The polarised 35.5 GHz Doppler radar is part of the Combined Radar And Lidar instrument (CORAL) at the Barbados Cloud Observatory (BCO). It has a sensitivity of -48 dBZ at an altitude of 5 km and -70 dBZ at an altitude of 500 m. The radar has a range gating of 31.18 m and measures at ranges between 150 m and 18.9 km. It operates in a zenith looking mode, so that range gating effectively measures distance in the vertical. To measure the vertical velocity the radar uses the Doppler technique with an FFT of 256 samples, giving it a Doppler resolution of < 0.02 m s-1 between -10 and 10 m s-1. The radar is able to provide the linear depolarisation ratio (LDR), which can be used for a target classification based on their shape. Data processing and radar calibration are done by following Görsdorf et al. (2015), which leads to an uncertainty of 1.3 dB.
Radar Characteristics
| Radar Type: | Mono static, pulsed, magnetron |
| Frequency: | 35.5 GHz +/- 150 MHz |
| Peak Power: | 30 kW |
| Pulse width: | 200 ns for 30 m range resolution |
| Doppler Velocity Resolution: | 0.02 m s-1 |
| Diameter of Antenna: | 2 m |
| Antenna Beam Width: | 0.3 deg x 0.3 deg |
| Sensitivity: | -48 dBZ at 5 km, -70 dBZ at 500 m |
Where to find the data?
The data from the CORAL cloud radar are all stored in the common NetCDF-Format and located under:
/pool/OBS/BARBADOS_CLOUD_OBSERVATORY/Level_1/B_Reflectivity/Ka-Band/MBR2/
The folder contains measurements with two different time resolution, the original 2 sec and the recalculated 10 sec.
The measurements of the CORAL cloud radar are available since 2015 and a detailed overview about the data availability is given here:
http://bcoweb.mpimet.mpg.de/systems/data_availability/DeviceAvailability.html
Some Python examples to start working with the data
How to load multiple files?
import xarray as xr
import glob

path = "/pool/OBS/BARBADOS_CLOUD_OBSERVATORY/Level_1/B_Reflectivity/Ka-Band/MBR2/10s/"
Filenames = sorted(glob.glob(path+"*MMCR__MBR2__*1812*"))
Radar_Files = xr.open_mfdataset(Filenames)
How to load a single file?
import xarray as xr

path = "/pool/OBS/BARBADOS_CLOUD_OBSERVATORY/Level_1/B_Reflectivity/Ka-Band/MBR2/10s/201804/MMCR__MBR2__Spectral_Moments__10s__155m-25km__180418.nc"
Radar_File = xr.open_dataset(path)
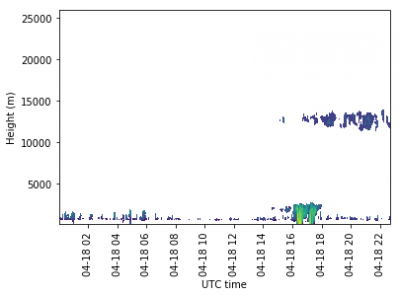
How to plot the radar reflectivity?
import xarray as xr
import matplotlib.pyplot as plt
import numpy as np

path = "/pool/OBS/BARBADOS_CLOUD_OBSERVATORY/Level_1/B_Reflectivity/Ka-Band/MBR2/10s/201804/MMCR__MBR2__Spectral_Moments__10s__155m-25km__180418.nc"
Radar_File = xr.open_dataset(path)

#Remove other signals than cloud signals
Ze = Radar_File.Ze.copy()
Ze_cloud = np.where(Ze < -50, np.nan, Ze)

Time = Radar_File.time.values.astype('datetime64[ns]')
Range= Radar_File.range.values

#Plot radar reflectivity
plt.contourf(Time,Range,Ze_cloud.transpose())
plt.xlabel("UTC time")
plt.ylabel("Height (m)")
plt.xticks(rotation=90)
How to calculate the cloud fraction and plot the result?
import xarray as xr
import matplotlib.pyplot as plt
import numpy as np

path = "/pool/OBS/BARBADOS_CLOUD_OBSERVATORY/Level_1/B_Reflectivity/Ka-Band/MBR2/10s/201804/MMCR__MBR2__Spectral_Moments__10s__155m-25km__180418.nc"
Radar_File = xr.open_dataset(path)

#Remove other signals than cloud signals
Ze = Radar_File.Ze.copy()
Ze_cloud = np.where(Ze < -50, np.nan, Ze)

Time = Radar_File.time.values.astype('datetime64[ns]')
Range= Radar_File.range.values
Mask = np.where(np.isnan(Ze_cloud)==False,1,np.nan)

#Calculate cloud fraction
CF = np.zeros(shape=(len(Range)))
for i in range(len(CF)):
    CF[i] = np.nansum(Mask[:,i])

CF = CF / len(Time) * 100

#Plot cloud fraction
plt.plot(CF,Range)
plt.xlabel("CF (%)")
plt.ylabel("Altitude (m)")
References
Measurements with the CORAL cloud radar:
Klingebiel, M., V.P. Ghate, A.K. Naumann, F. Ditas, M.L. Pöhlker, C. Pöhlker, K. Kandler, H. Konow, and B. Stevens, 2019: Remote sensing of sea salt aerosol below trade wind clouds. J. Atmos. Sci., https://doi.org/10.1175/JAS-D-18-0139.1
Calibration of the CORAL cloud radar:
Görsdorf, U., V. Lehmann, M. Bauer-Pfundstein, G. Peters, D. Vavriv, V. Vinogradov, and V. Volkov, 2015: A 35-GHz polarimetric Doppler radar for long-term observations of cloud parameters—Description of system and data processing. J. Atmos. Oceanic Technol., 32, 675–690, https://doi.org/10.1175/JTECH-D-14-00066.1.
Description of the BCO:
Stevens, B., et al., 2016: The Barbados Cloud Observatory — anchoring investigations of clouds and circulation on the edge of the ITCZ. Bulletin of the American Meteorological Society, 97, 787-801 , https://doi.org/10.1175/BAMS-D-14-00247.1


